
 Tiếng Việt
 中文 (台灣)
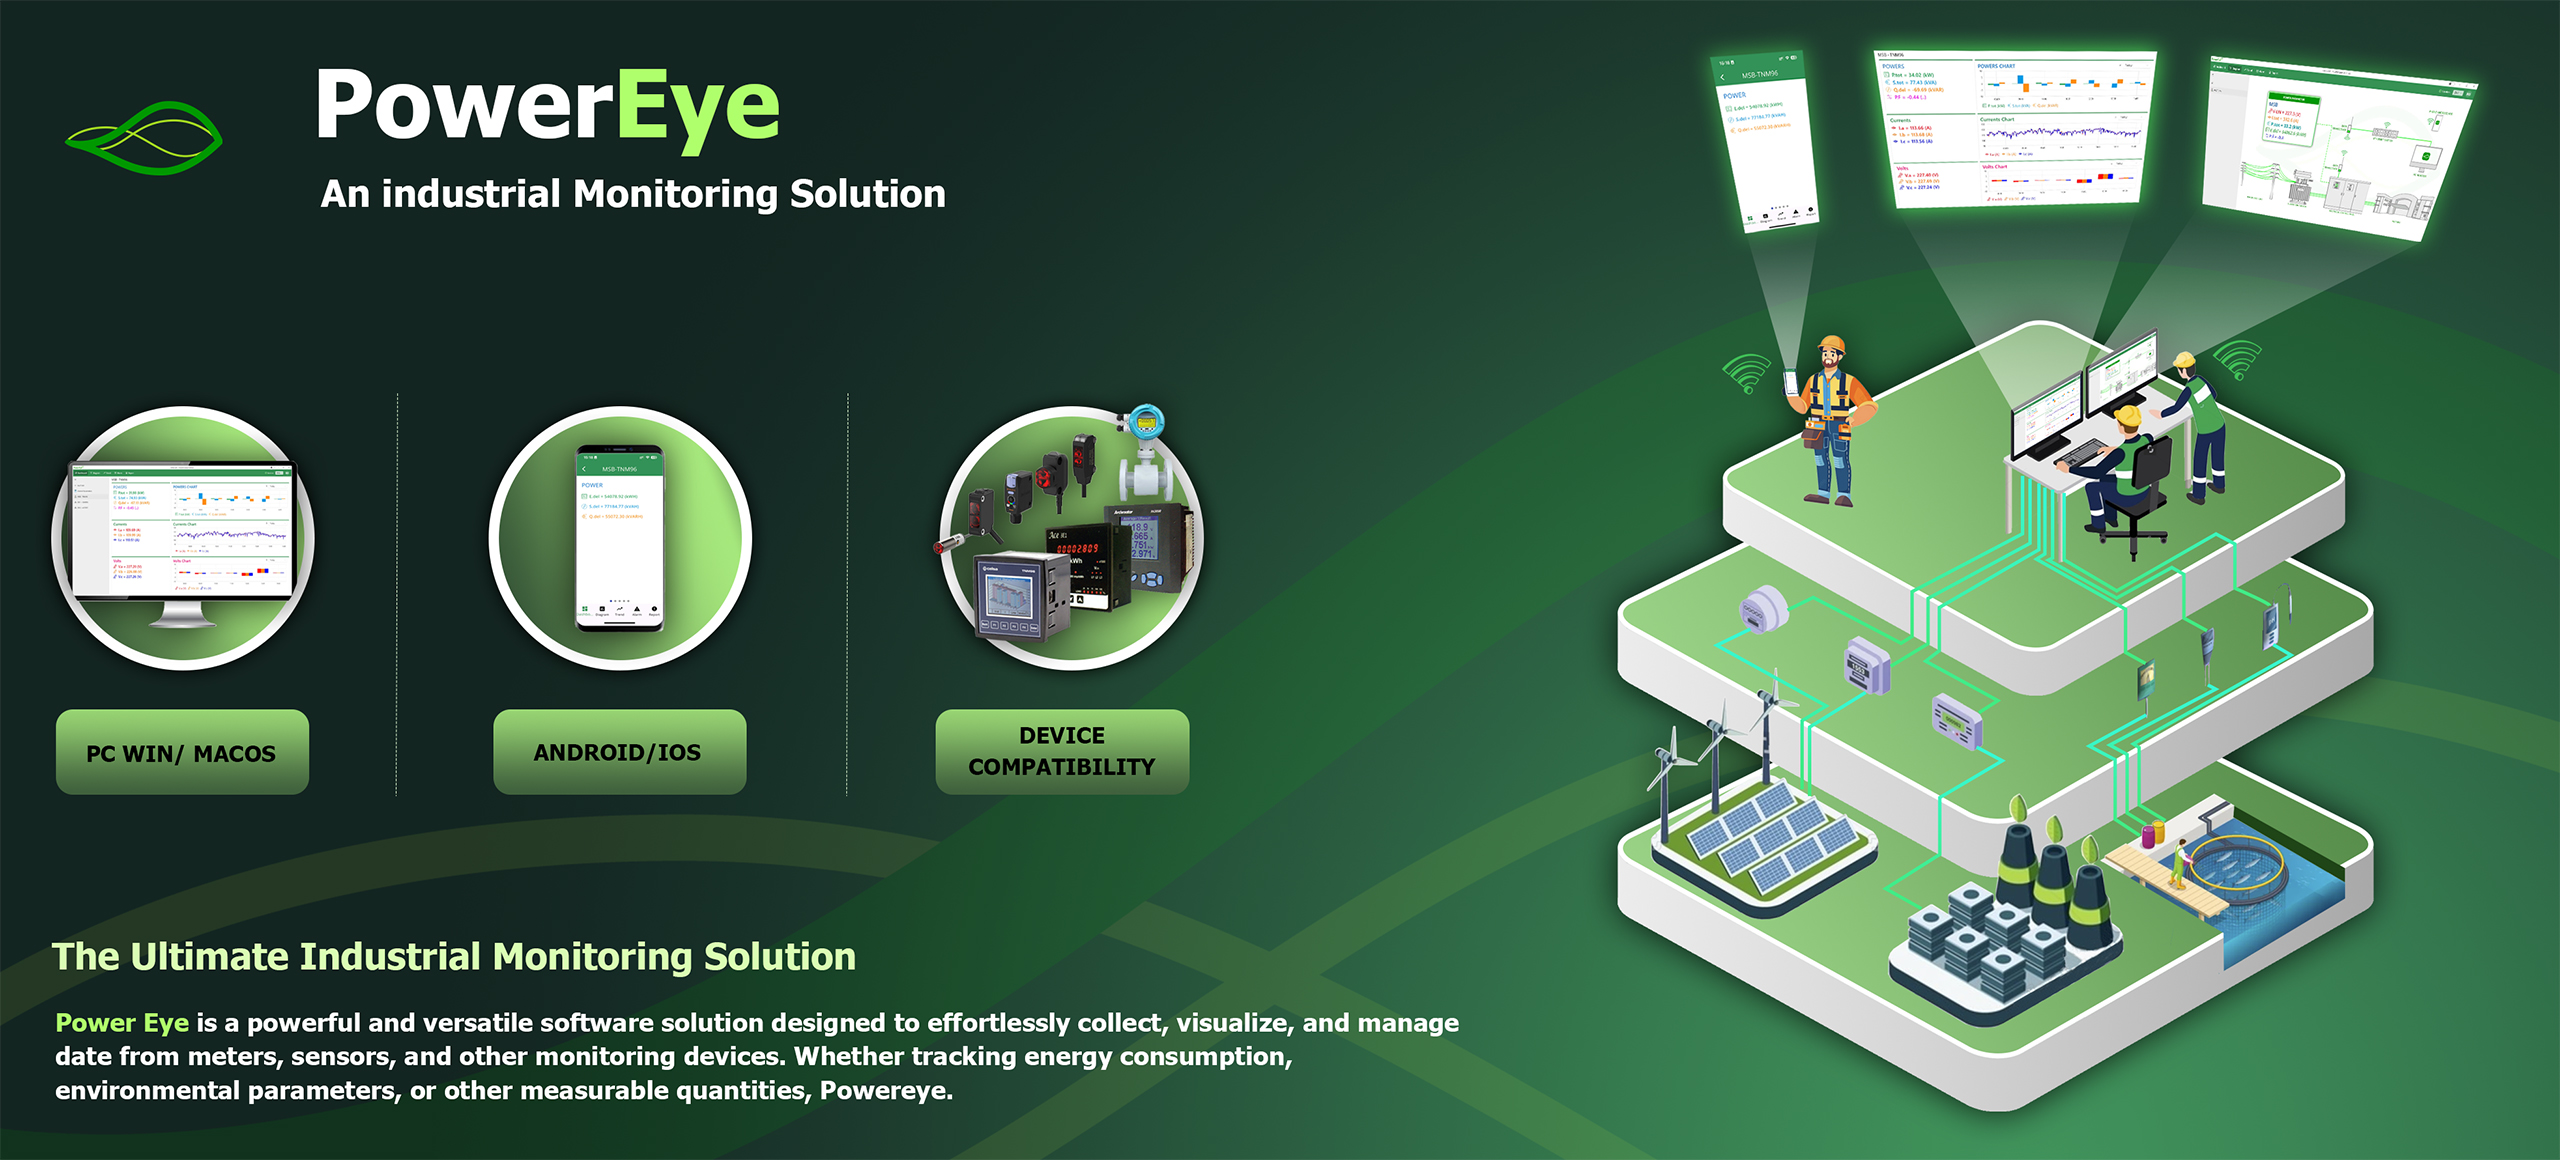
Our Services
We provide a comprehensive suite of service to ensure seamless monitoring and management of industrial data.

6 System Modules
10 Core Features

Projects

Markets
Open & Flexible Energy Platform
Connect, collect and visualize data from any device, any brand.
Overview & Quick Start
Ready to Optimize Your System?Video 1: Installation & Activation
![]()
Coming soon!
Video 2: Configuring Devices
![]()
Coming soon!
Aplication
Factories & Manufacturing

Building Office & Corporate Facilities

Shopping Malls & Retail Spaces

Shopping Malls & Retail Spaces

Workshop & Warehouses

Hospitals & Healthcare Centers
Industrial park substations

Radio and Television Station

Educational Institution
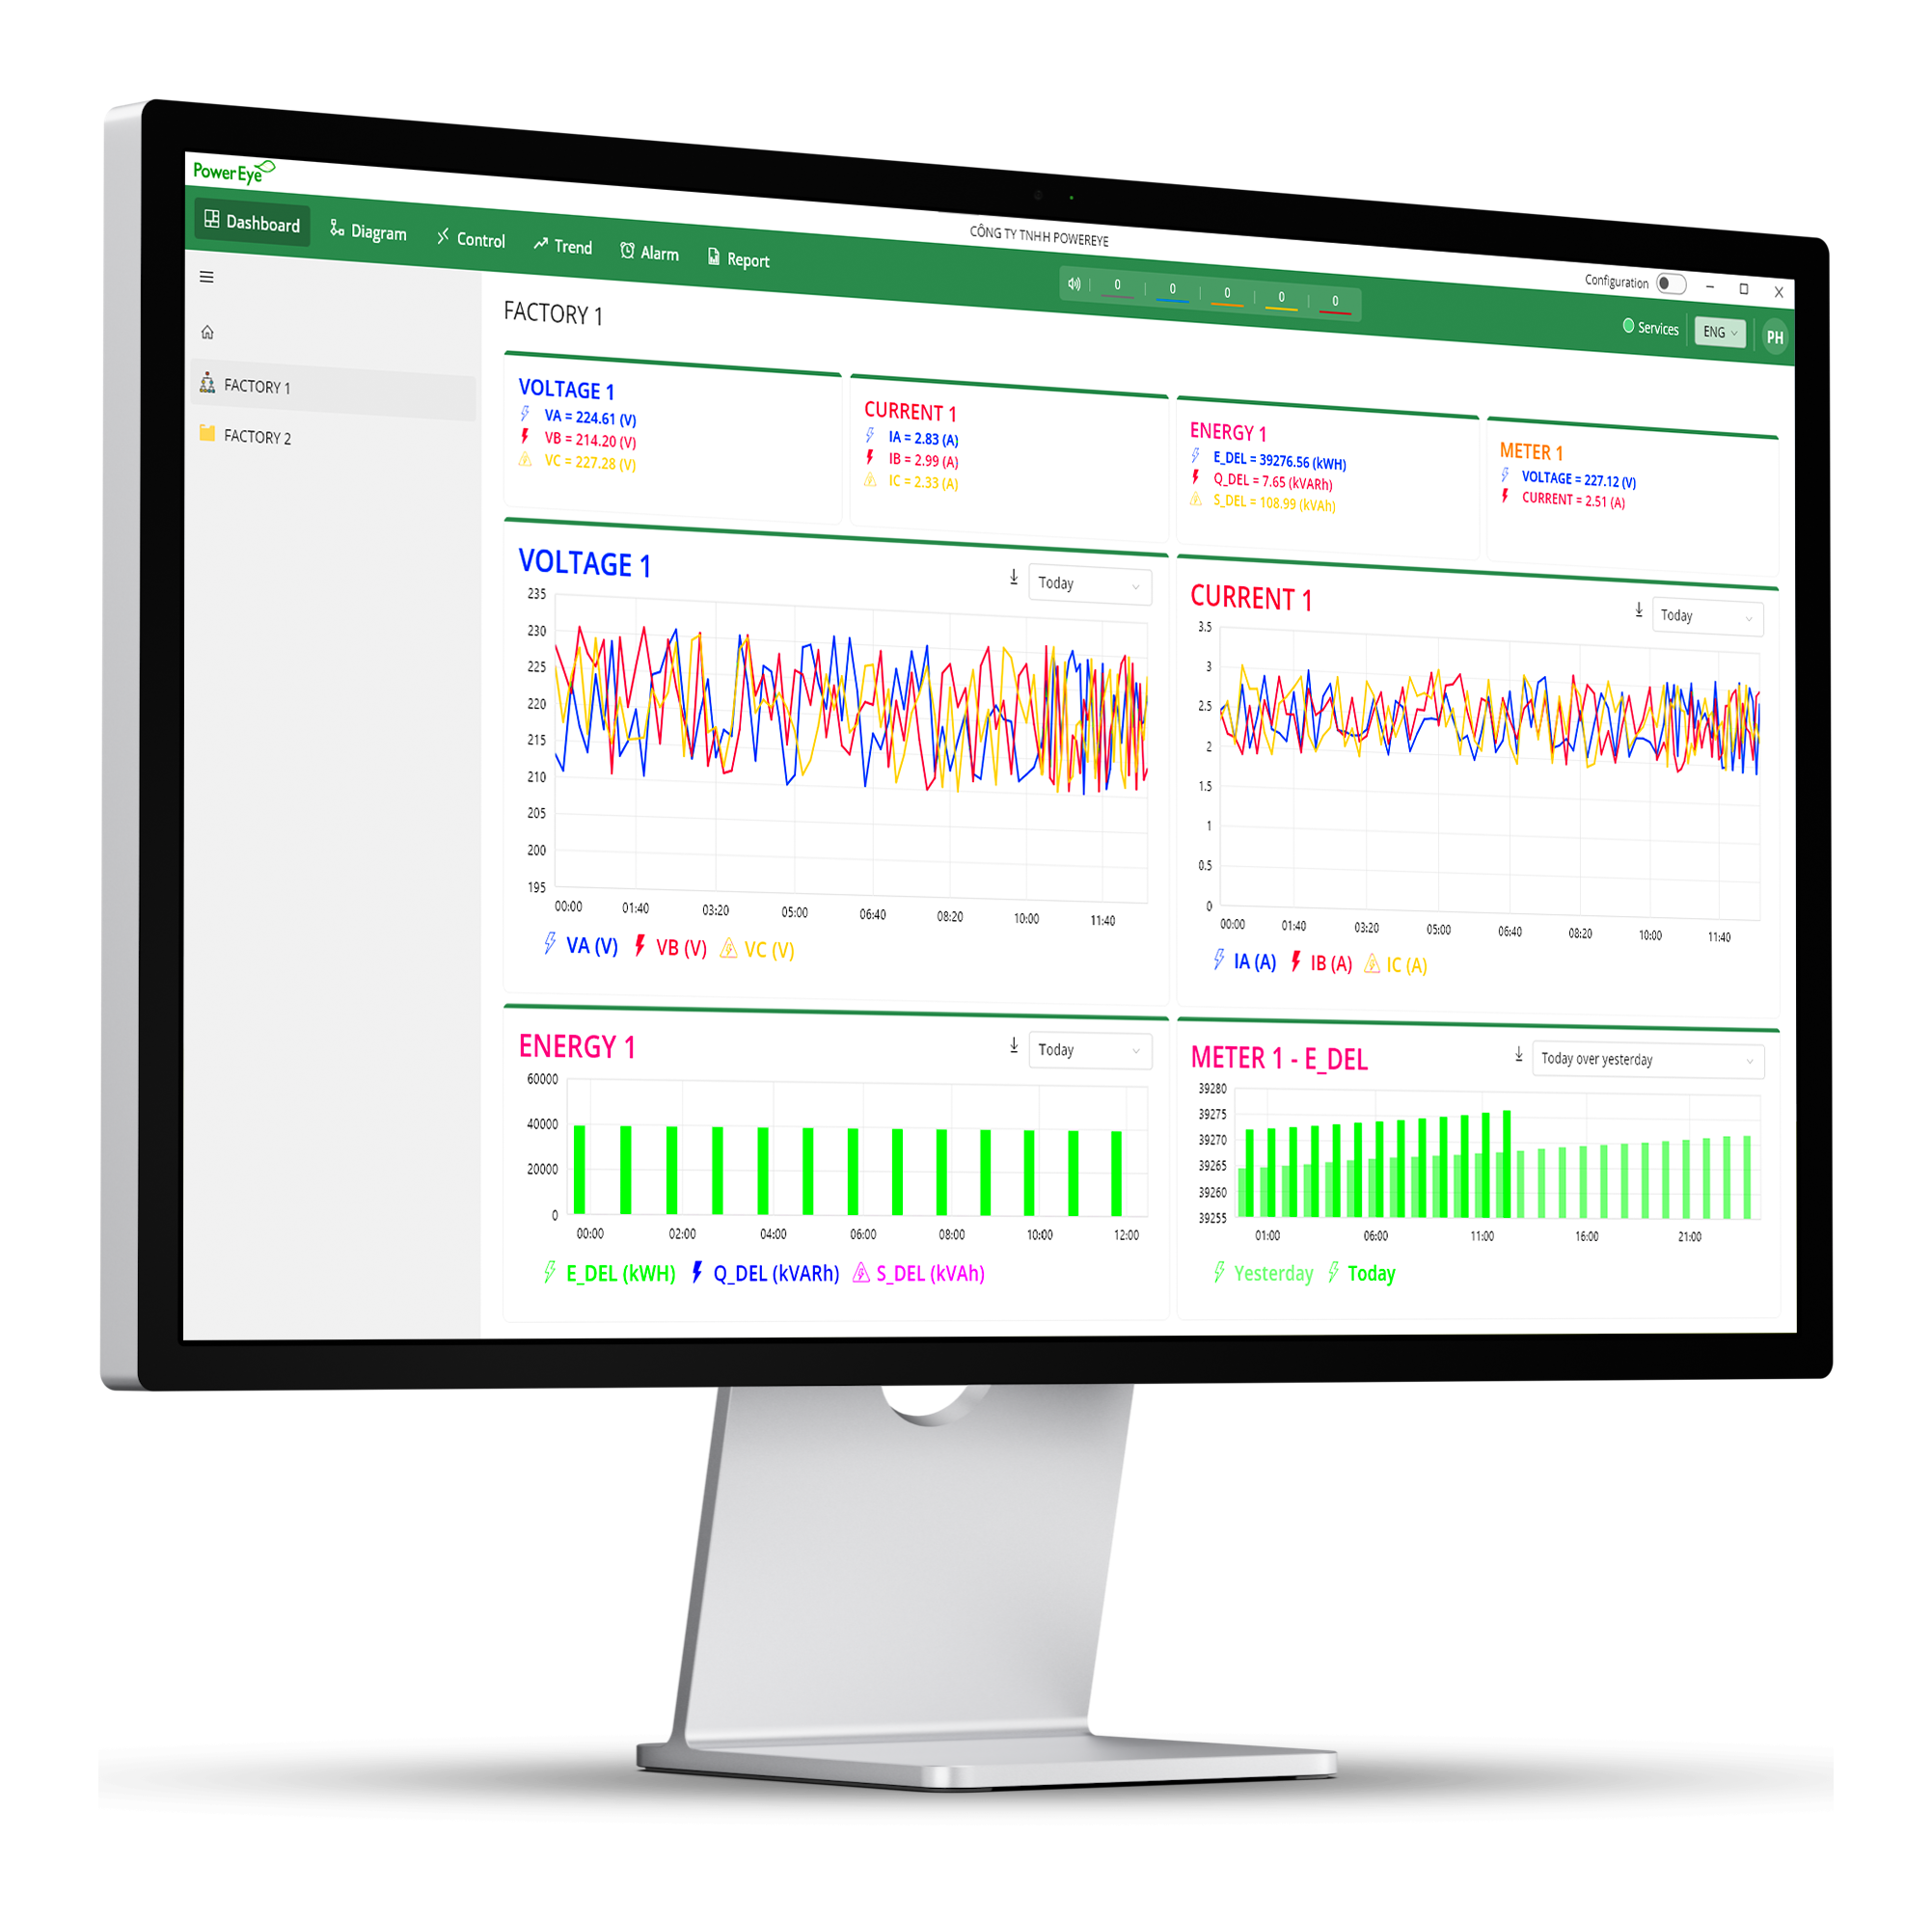
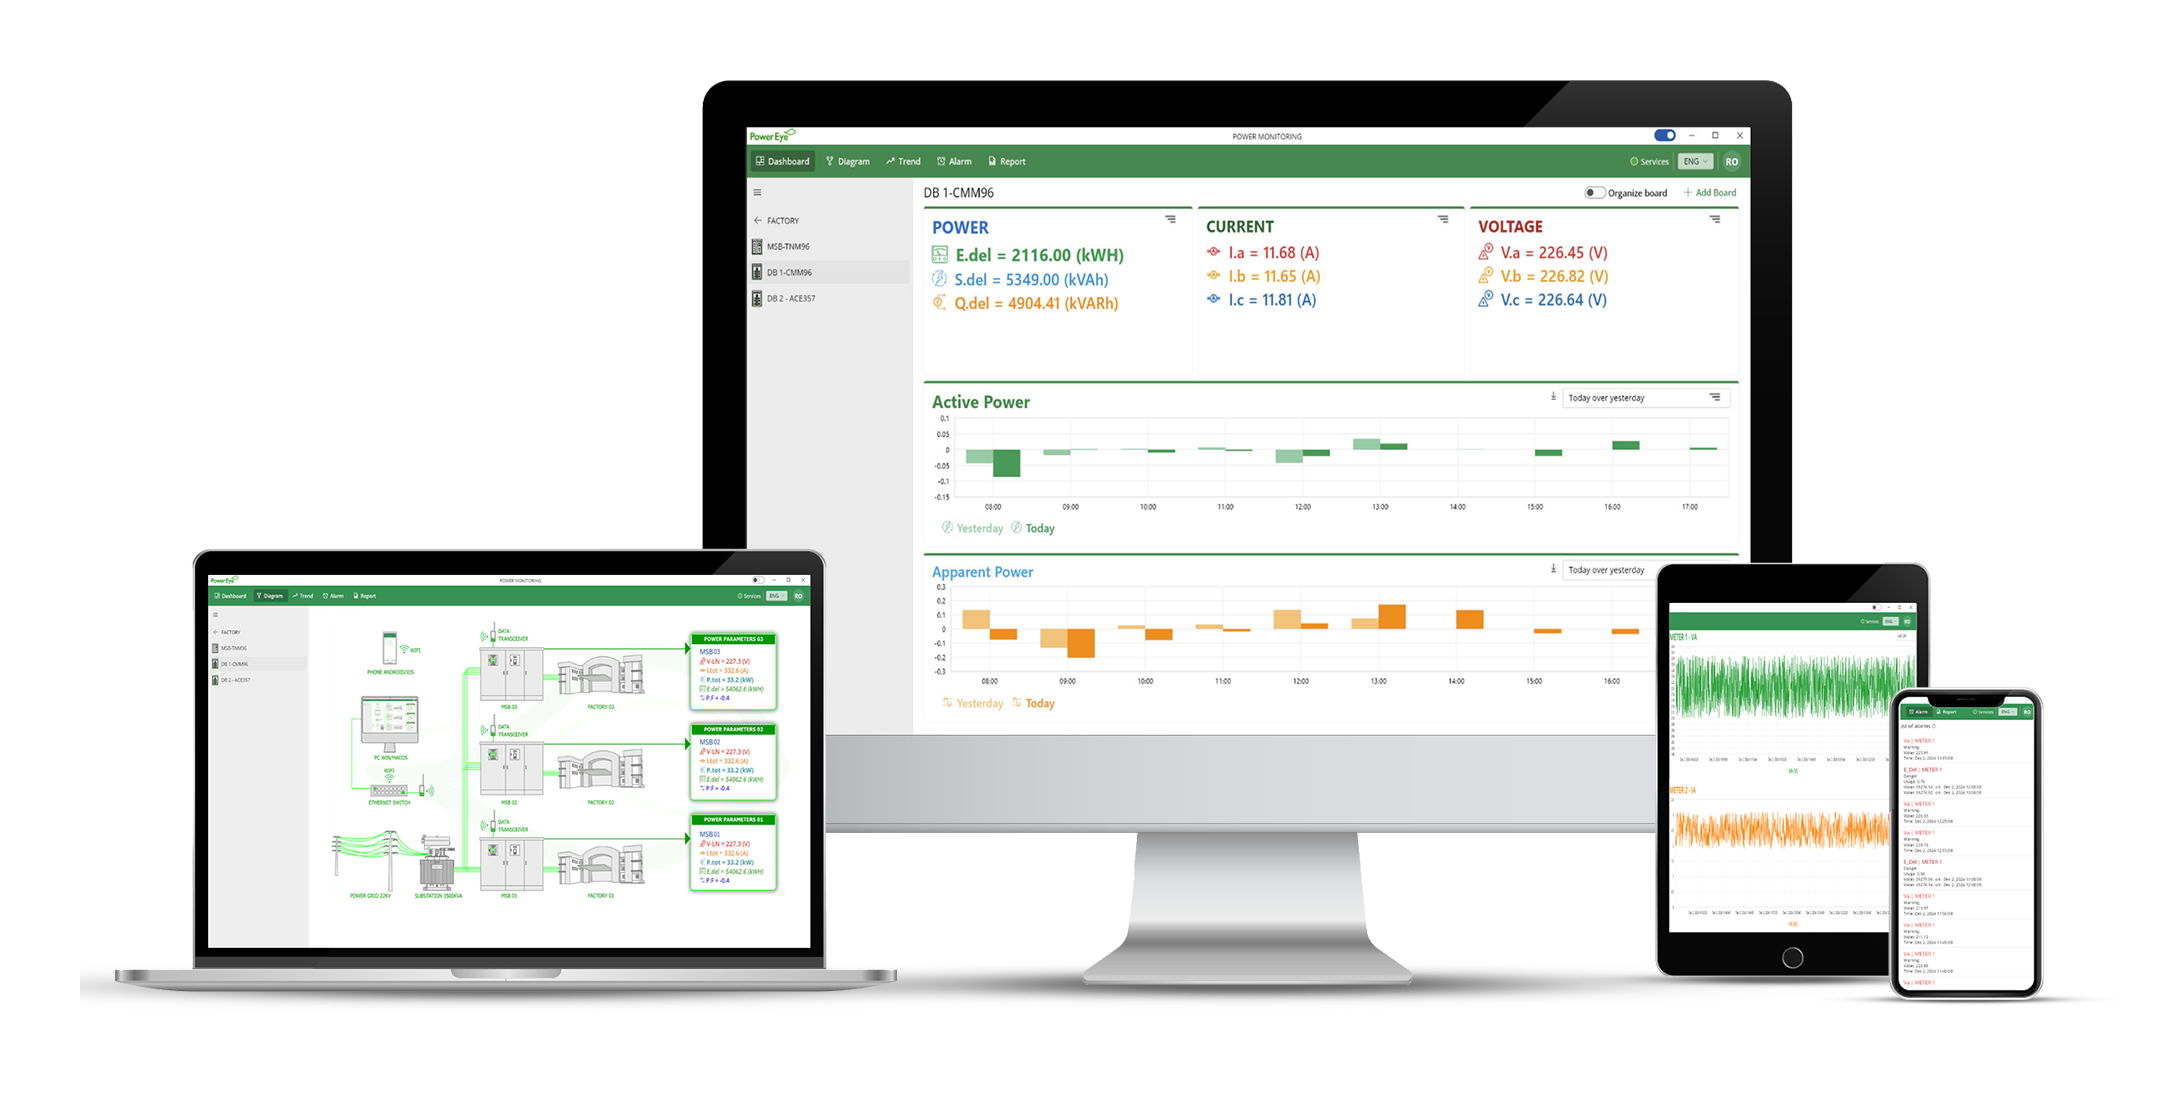
Dashboard
Enhance Your Data Monitoring with Interactive Features
The dashboard provides multiple ways to visualize, compare, and filter your data, offering
flexibility and deeper insights into performance monitoring.
- ✅ Data Visualization: Display information in text, line charts, and column charts.
- ✅ Comparative Analysis: Compare periods such as ‘Today vs Yesterday’ or ‘This week vs Last week’.
- ✅ Data Filtering: View data for specific periods like ‘Latest’, ‘Today’, or ‘Last 24 hours’.
- ✅ Hierarchy: Organize dashboards in a structured way similar to folder management.
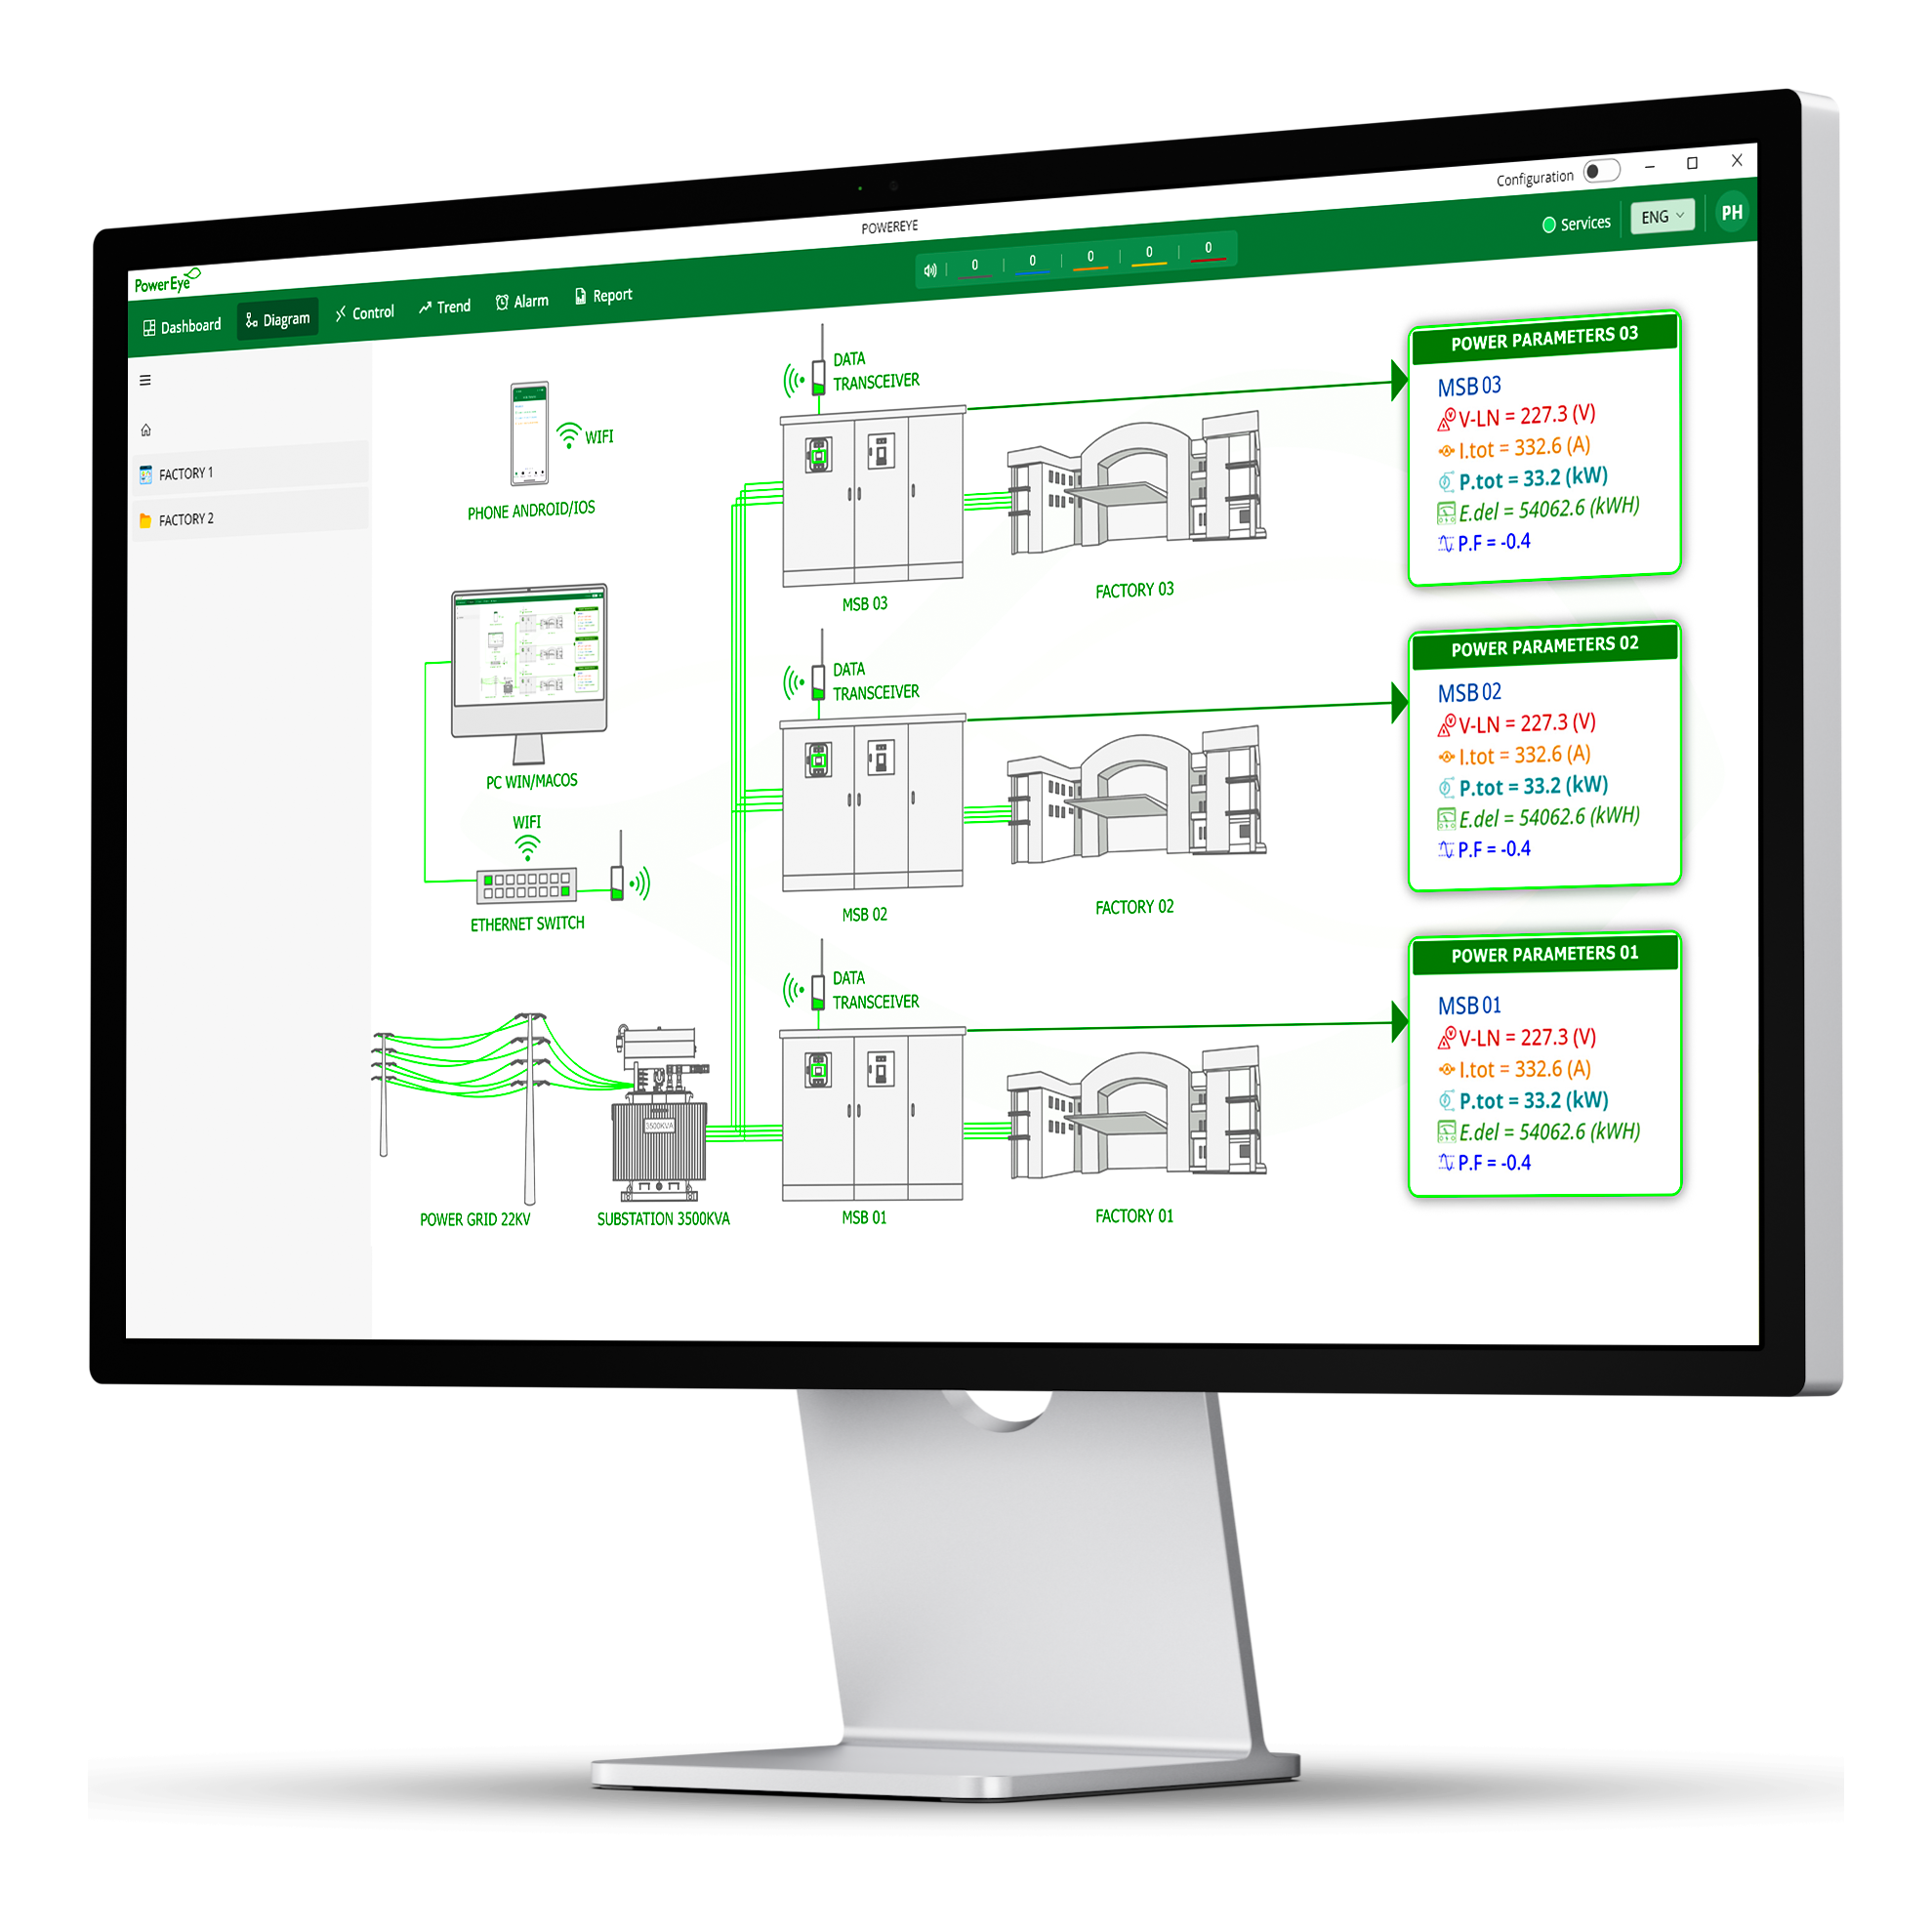
DIAGRAM
Visualize Device Layouts and Real-Time Data
In PowerEye, diagrams act as virtual blueprints, allowing you to see the
entire system at a glance. Instead of visiting each device physically,
you can import system layouts and monitor live measurements directly
at each device location within the software.
- ✅ Device Visualization: Import diagrams that reflect your system layout.
- ✅ Real-Time Monitoring: View live data directly at device locations.
- ✅ Hierarchy: Organize and customize dashboards with a folder-like structure.
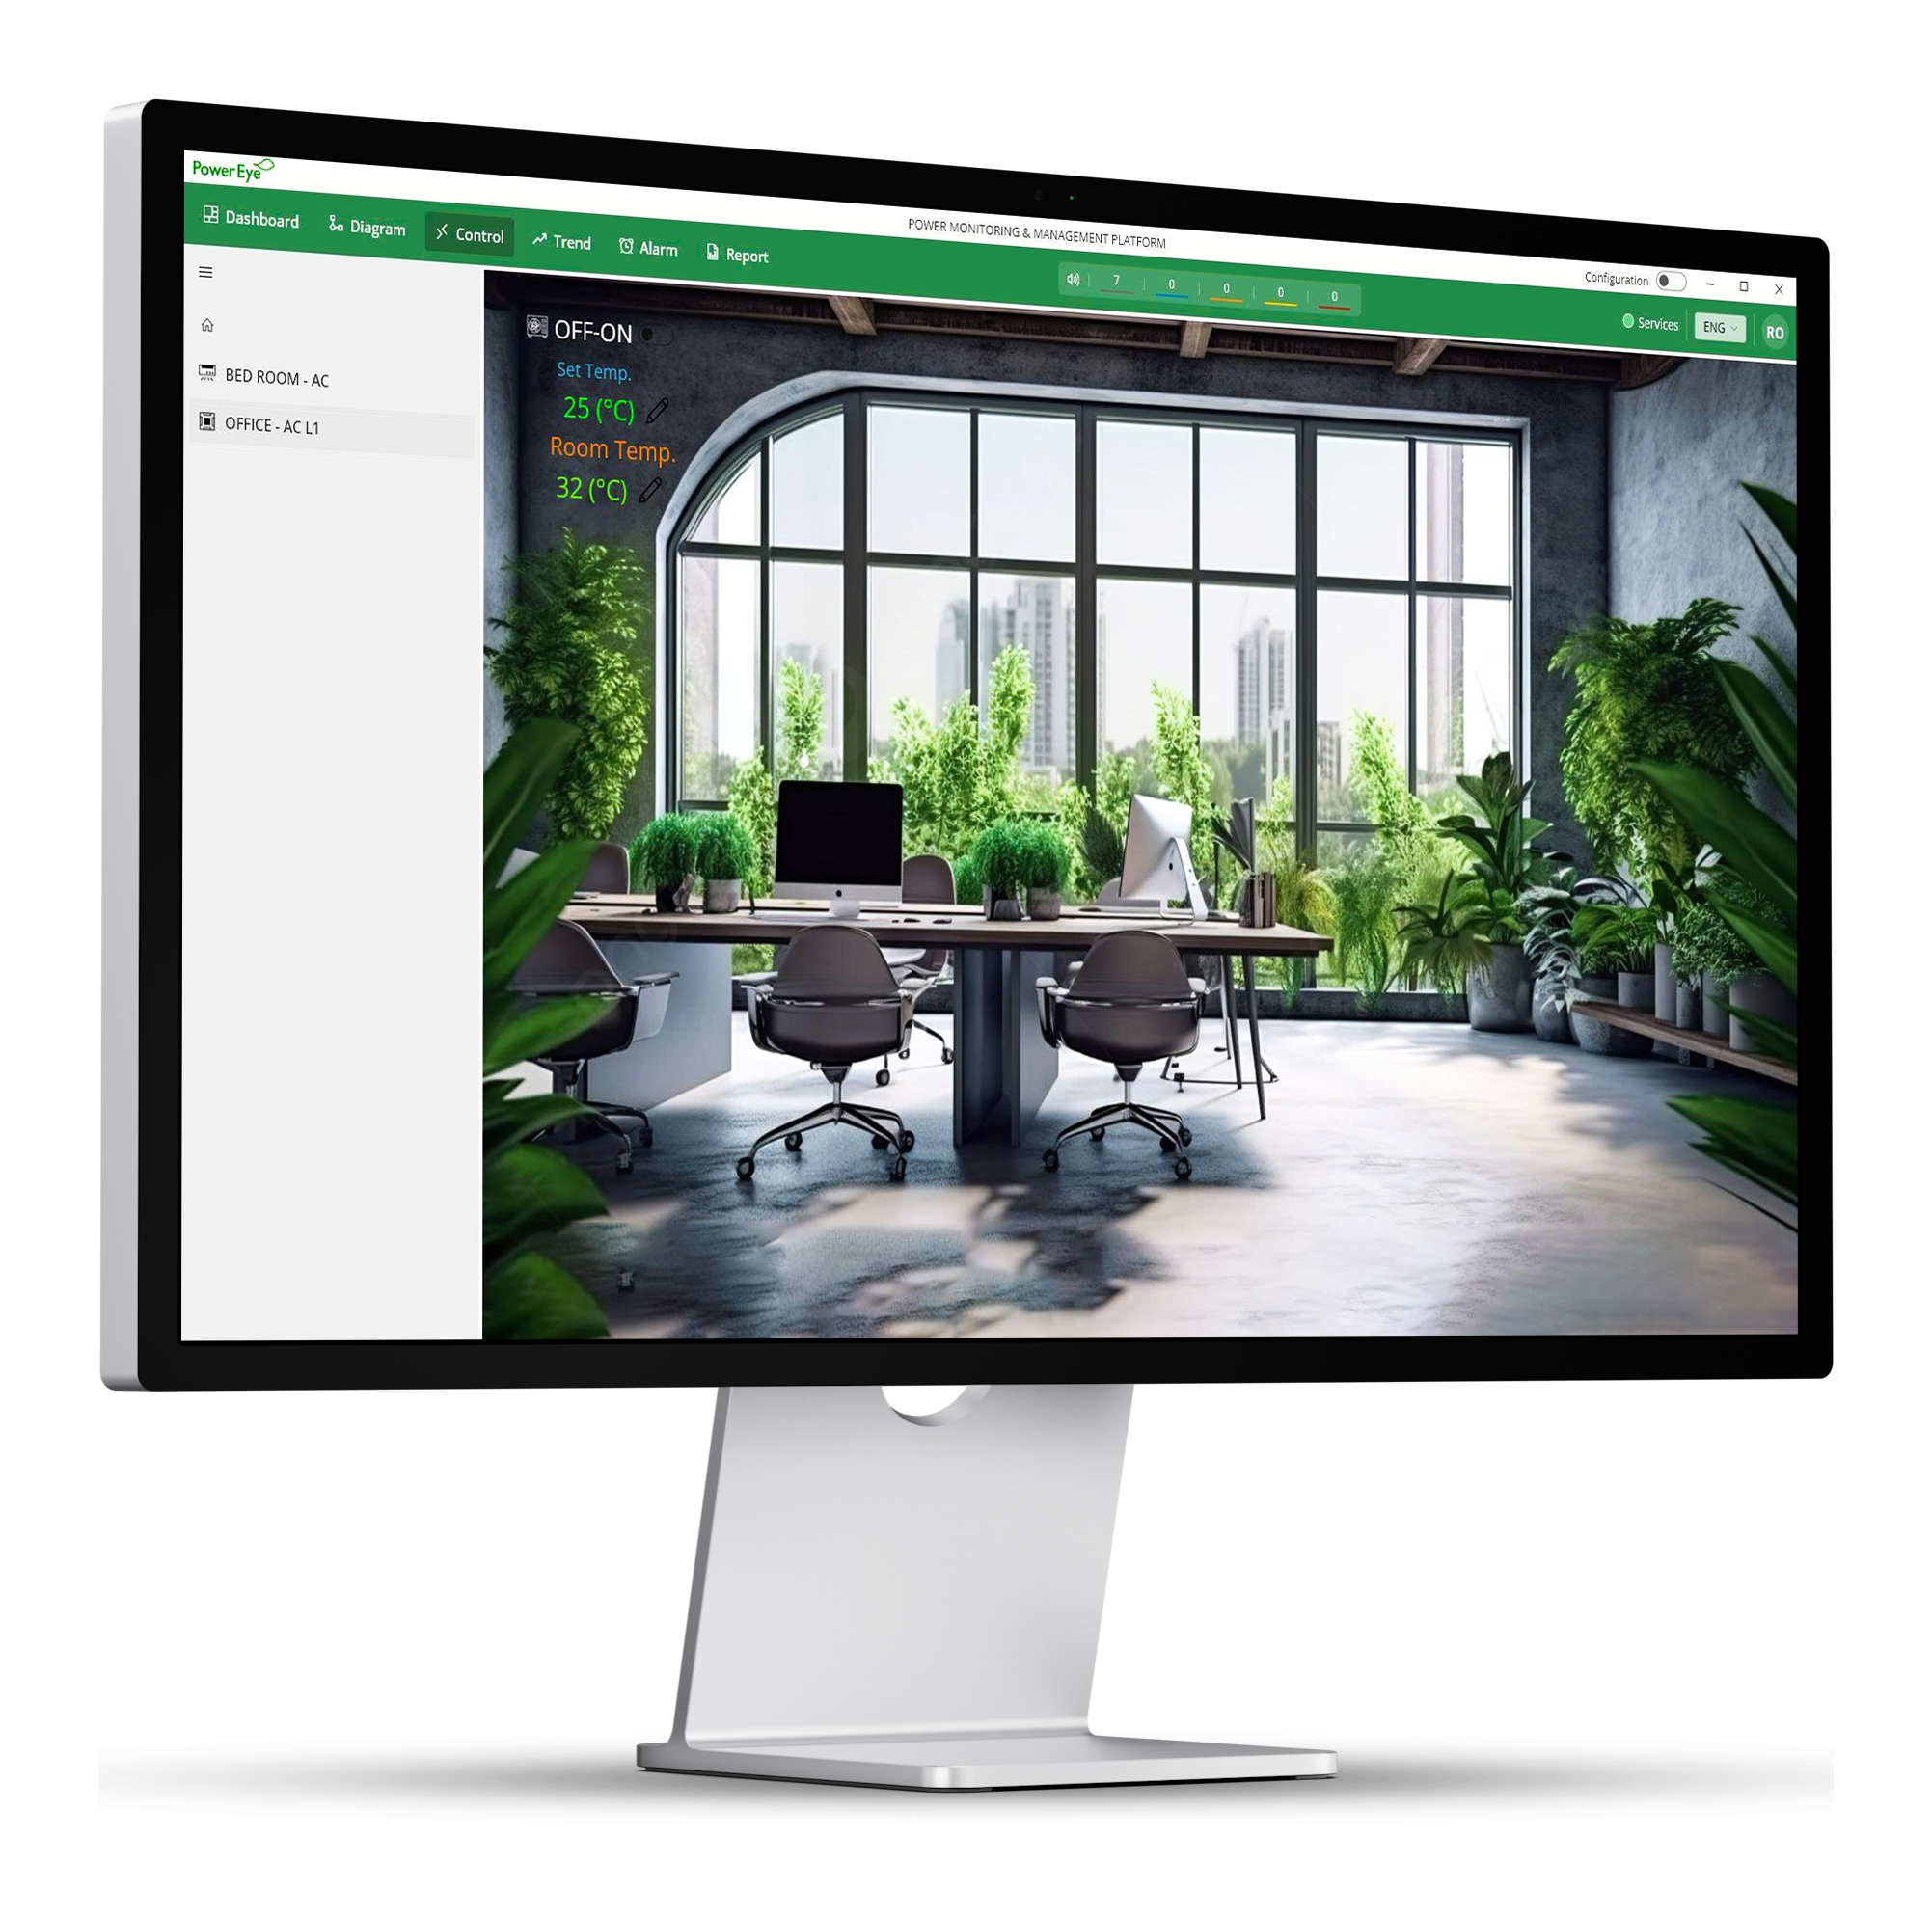
Control
Gain Deeper Insights with Flexible Control Features
PowerEye’s Control module empowers you with diagram-based visualization, comparative analysis, and hierarchical structuring.
These tools allow you to observe system status directly on diagrams, control devices in real time, and ensure effective monitoring and timely decision-making.
- ✅ Visualization: Display device status and information directly on the diagram through icons, connections, or charts.
- ✅ Comparative Analysis: Compare device conditions or performance across different periods (e.g., ‘Today vs Yesterday’, ‘This Week vs Last Week’).
- ✅ Direct Control: Operate devices by switching ON/OFF or adjusting parameters directly on the diagram, without navigating through sub-menus.
- ✅ Hierarchy: Organize diagrams from company-wide overviews down to specific areas or individual devices.
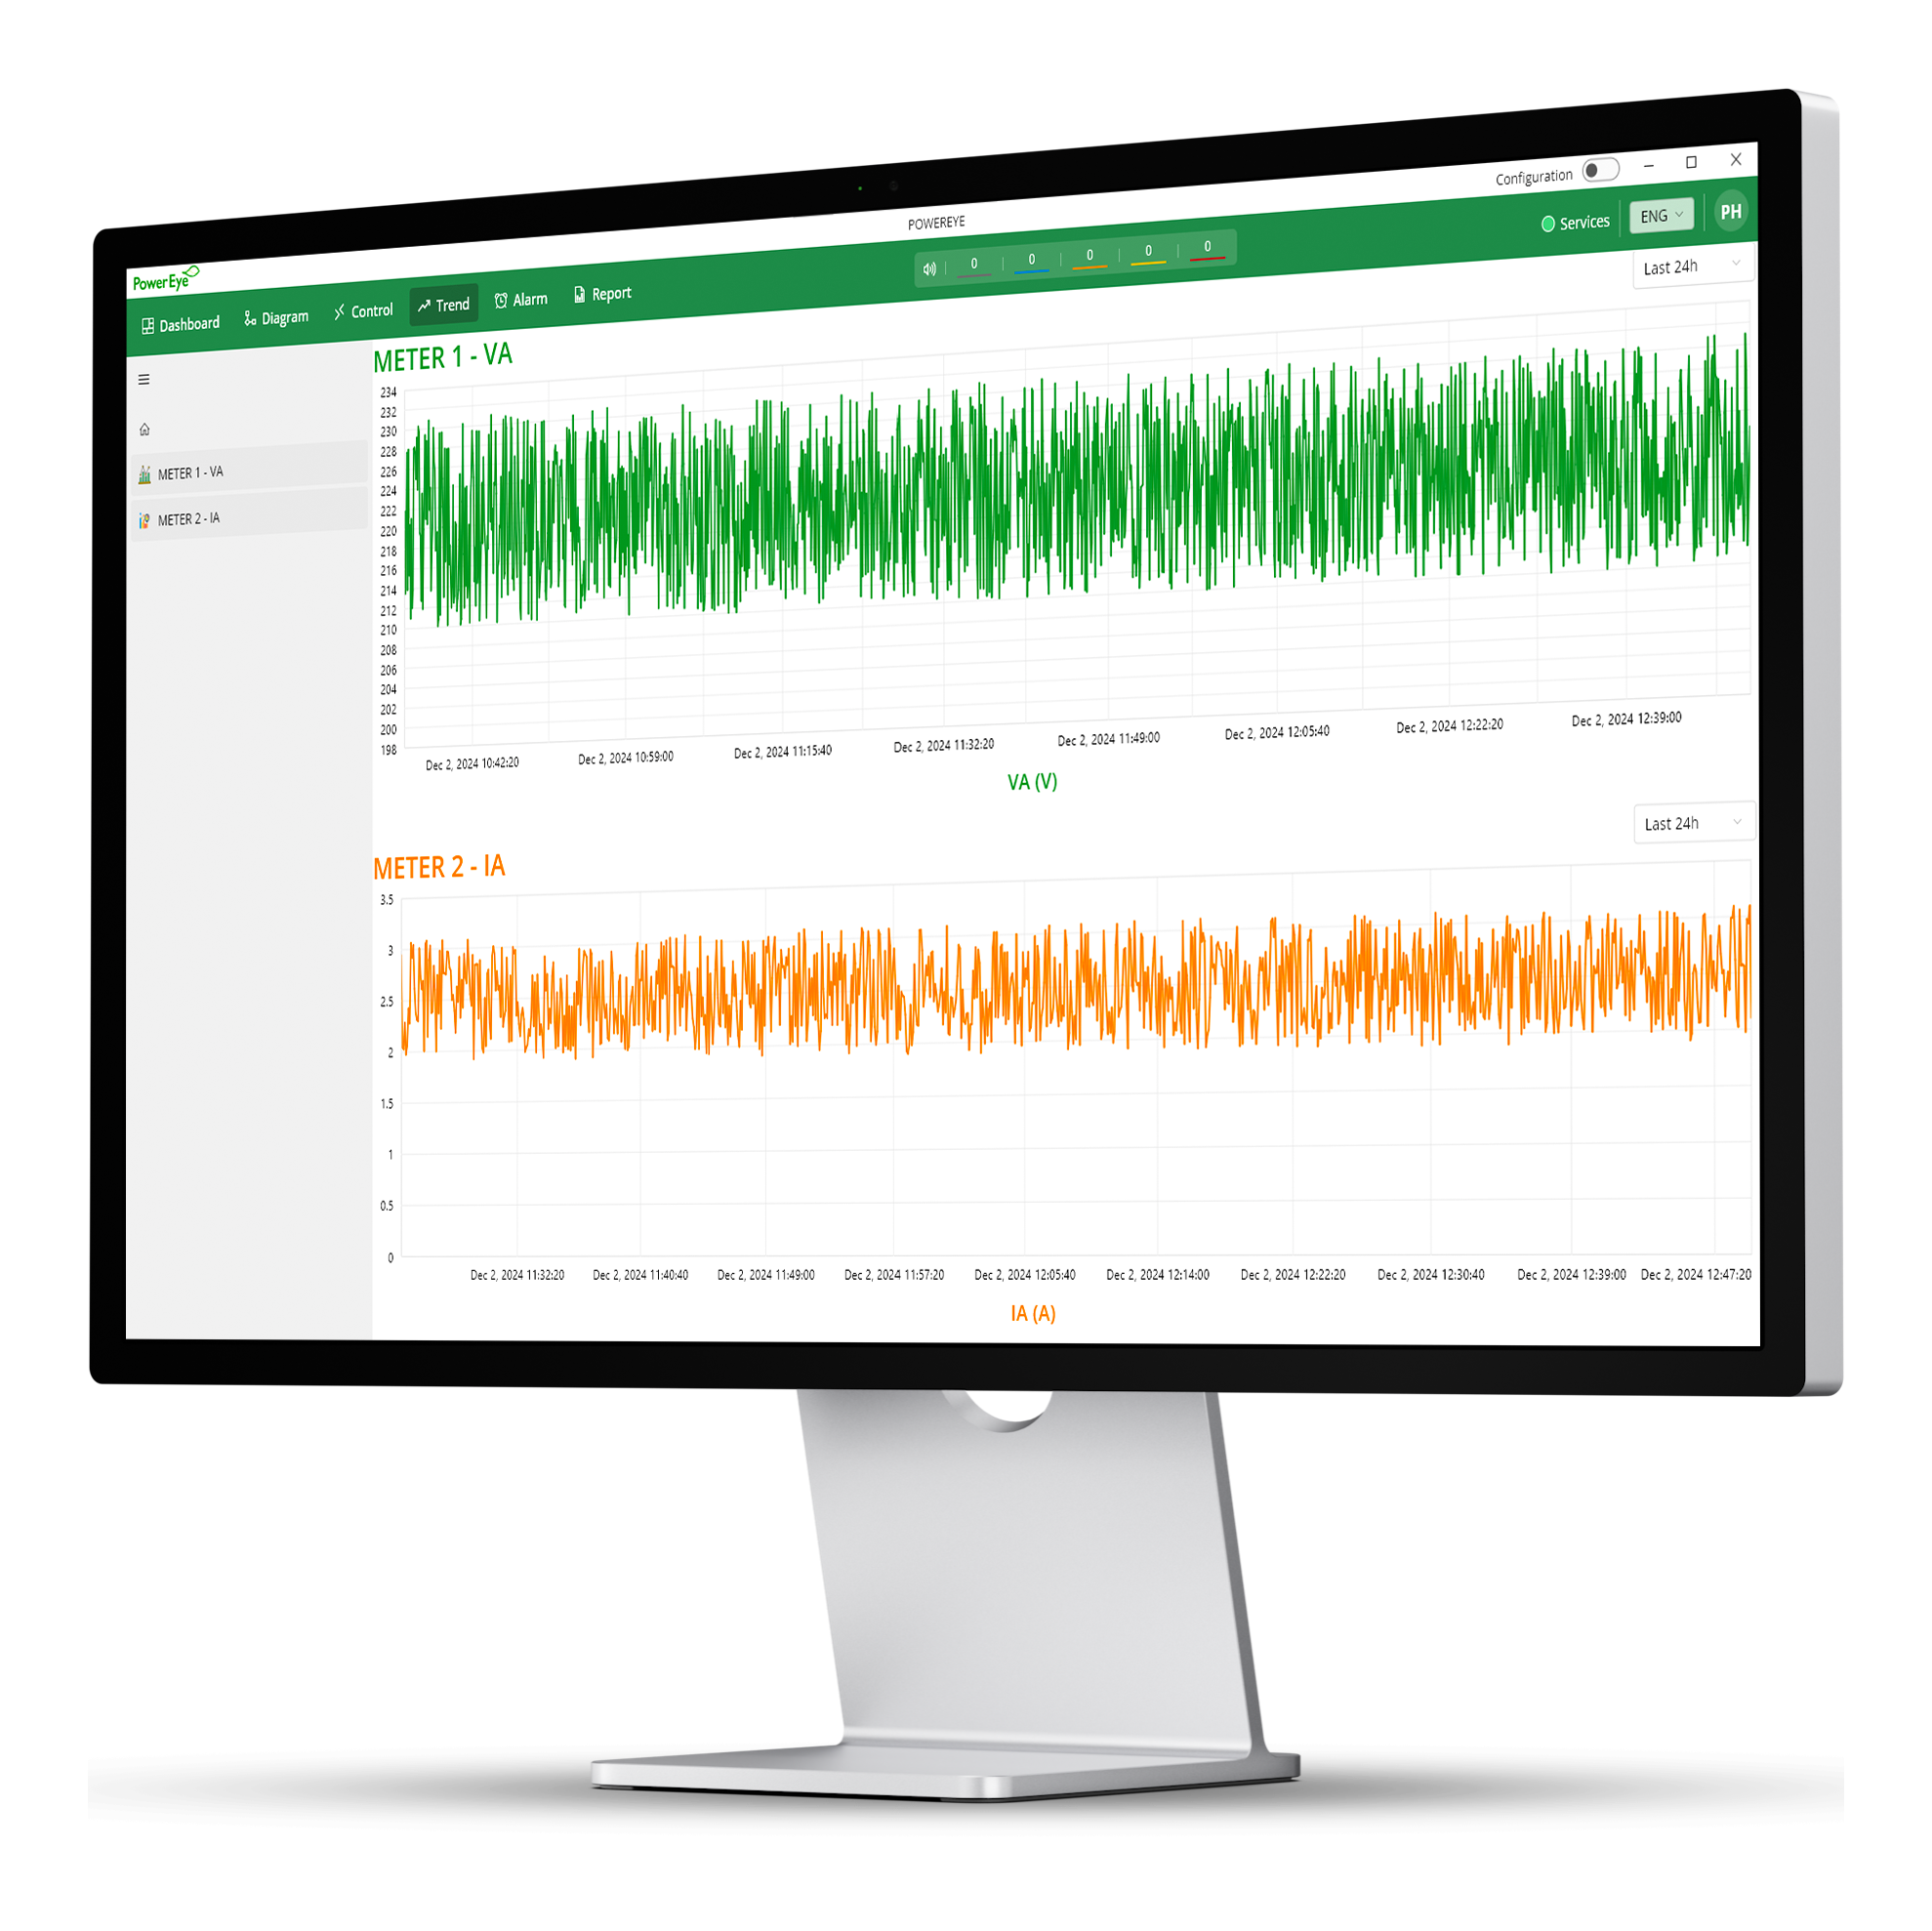
Trend
Real-Time Trend Analysis for Smarter Decisions
The Trend feature provides real-time line charts to help you identify
patterns, monitor changes, and gain deeper insights into your data.
Customize, explore, and control your trend charts with powerful
interactive tools.
- ✅ Real-Time Line Charts: Continuously updated visualizations that show how data evolves over time.
- ✅ Insightful Analysis: Detect patterns, predict behaviors, and uncover issues earlier.
- ✅ Custom Trends: Configure charts for single metrics or compare multiple data points.
- ✅ Interactive Exploration: Zoom or scroll through charts with simple mouse controls.
- ✅ Data Recording Control: Toggle recording on/off for flexible trend analysis.
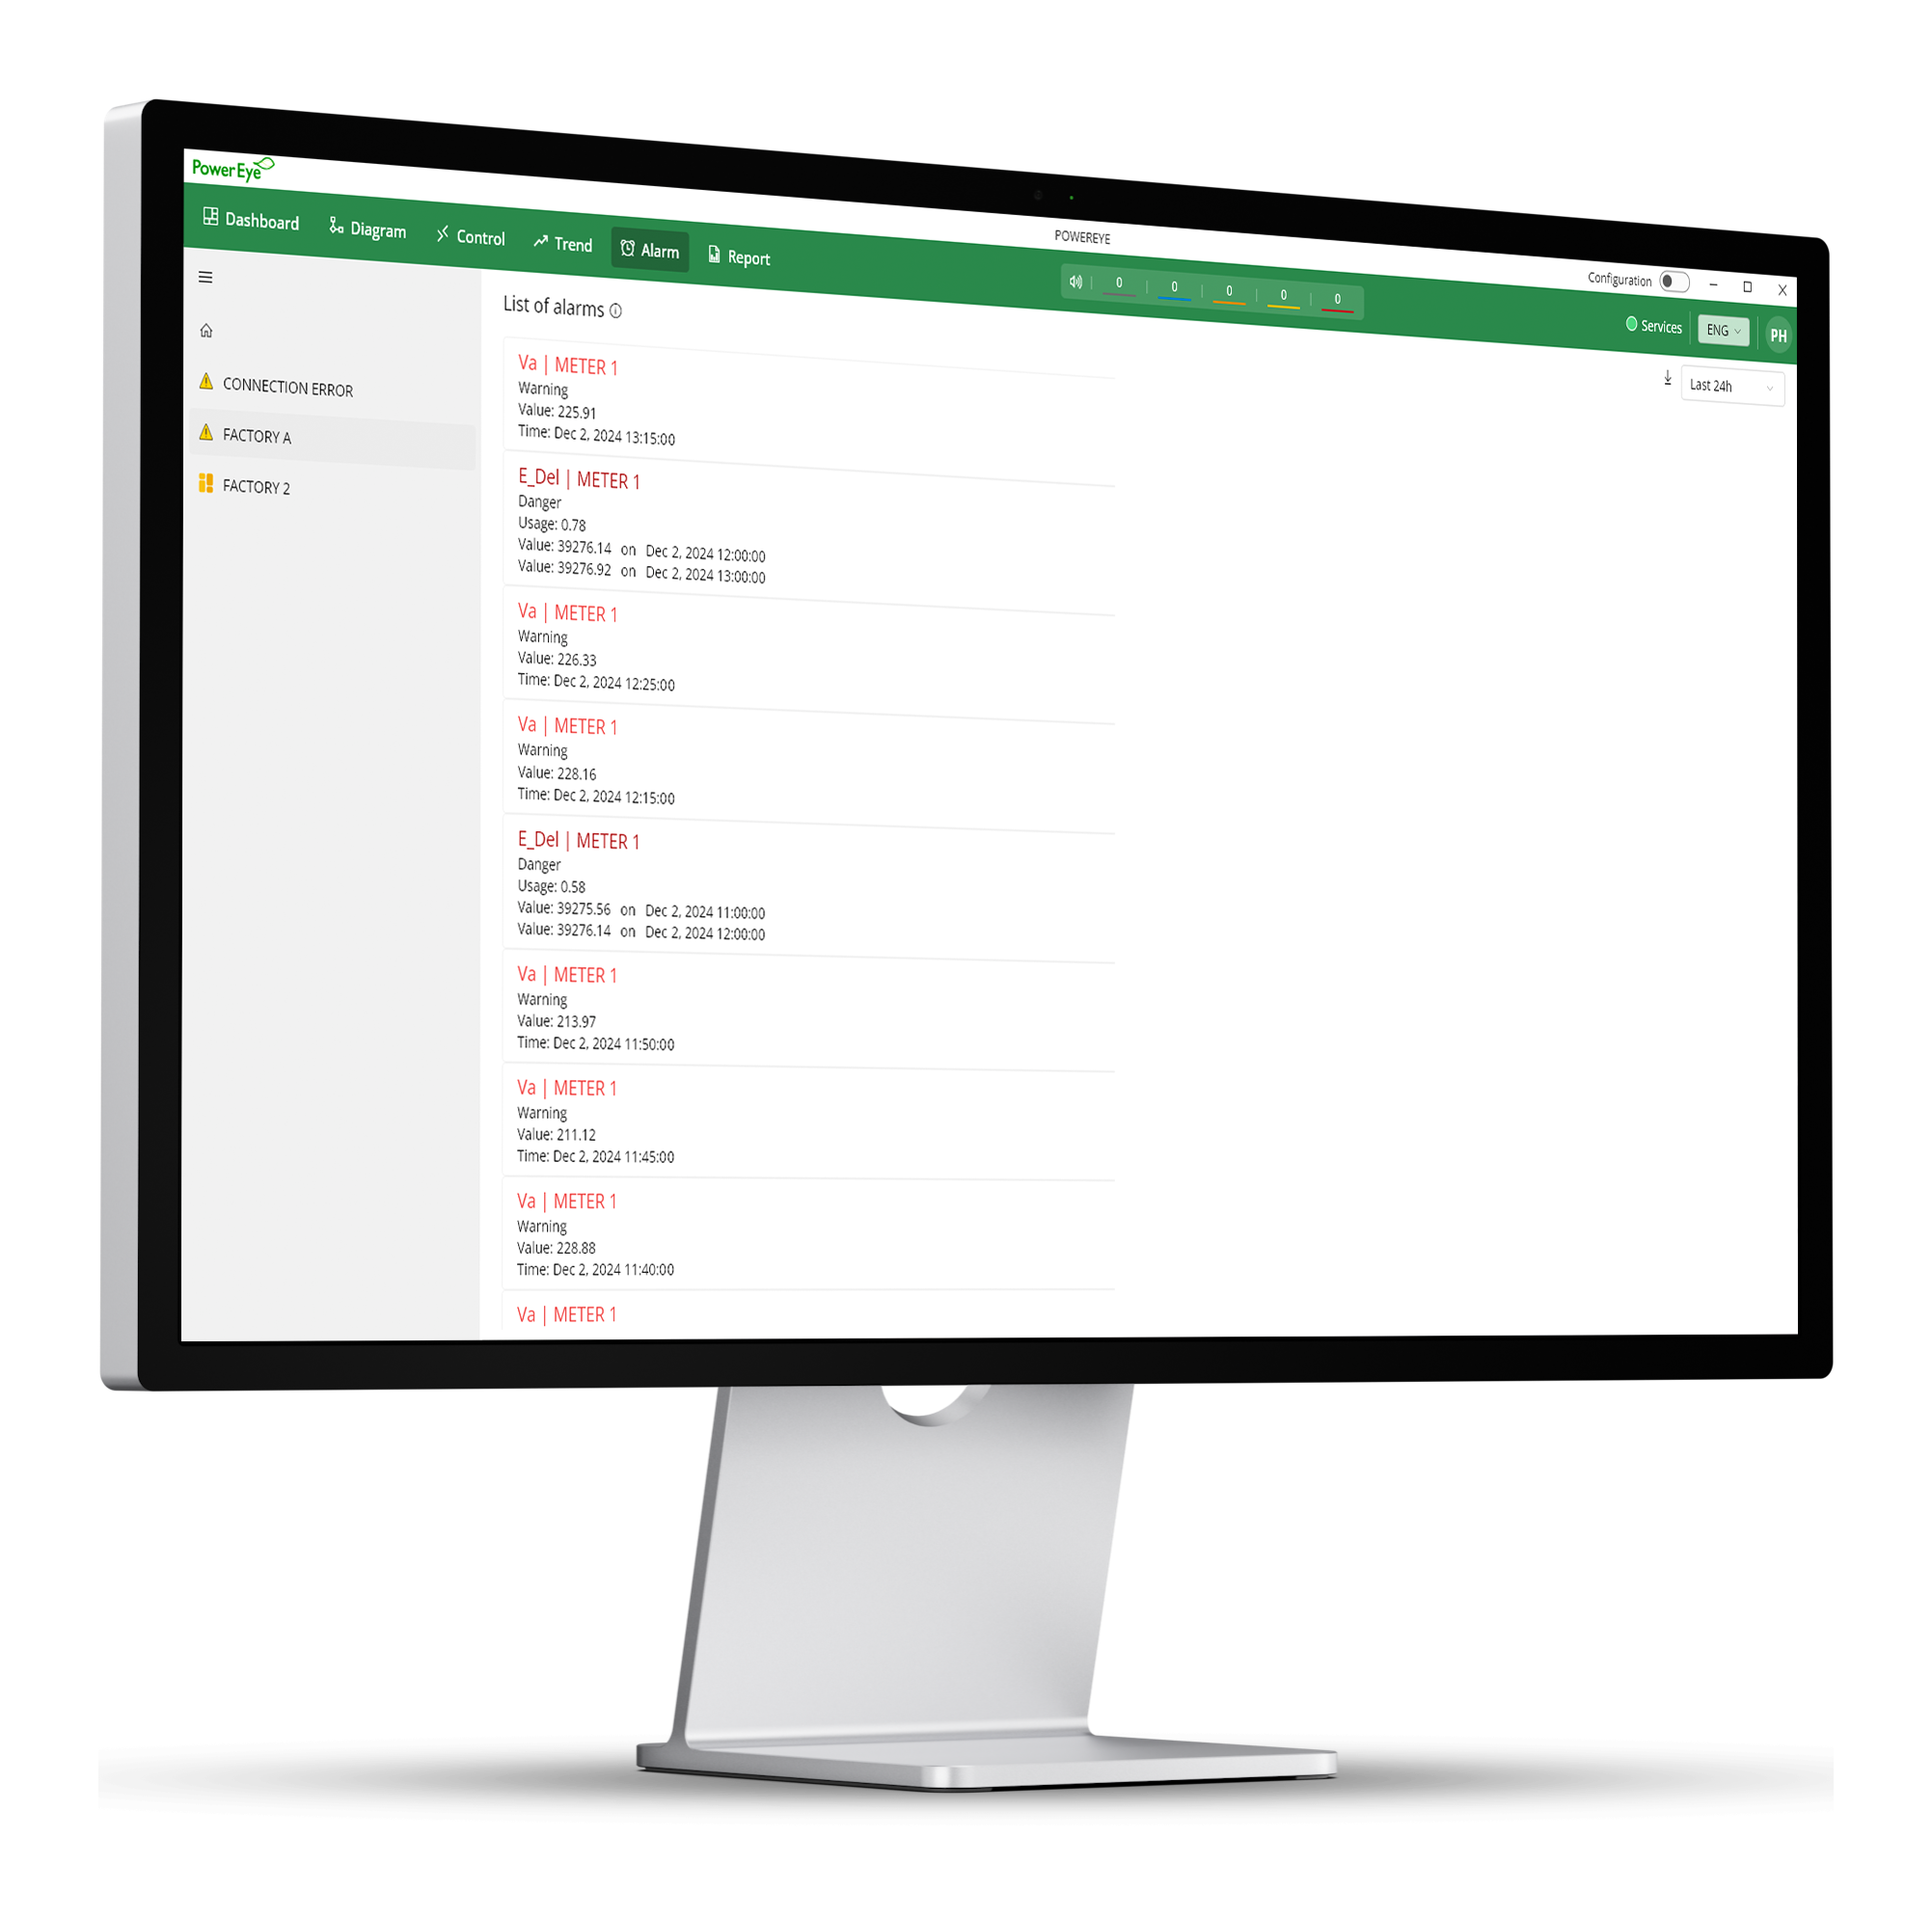
Alarm
Stay Alert with Smart Monitoring and Notifications
PowerEye’s Alarm feature ensures you never miss critical events.
From device connectivity to safety thresholds and consumption tracking,
alarms provide timely alerts to keep your system safe and efficient.
- ✅ Device Connection Monitoring: Instantly detect sensor, meter, or device connection errors.
- ✅ Range Limit Alarms: Get alerts when metrics like voltage, pressure, or temperature approach safety limits.
- ✅ Usage Alarms: Monitor data consumption (e.g., energy) and receive notifications when thresholds are exceeded.
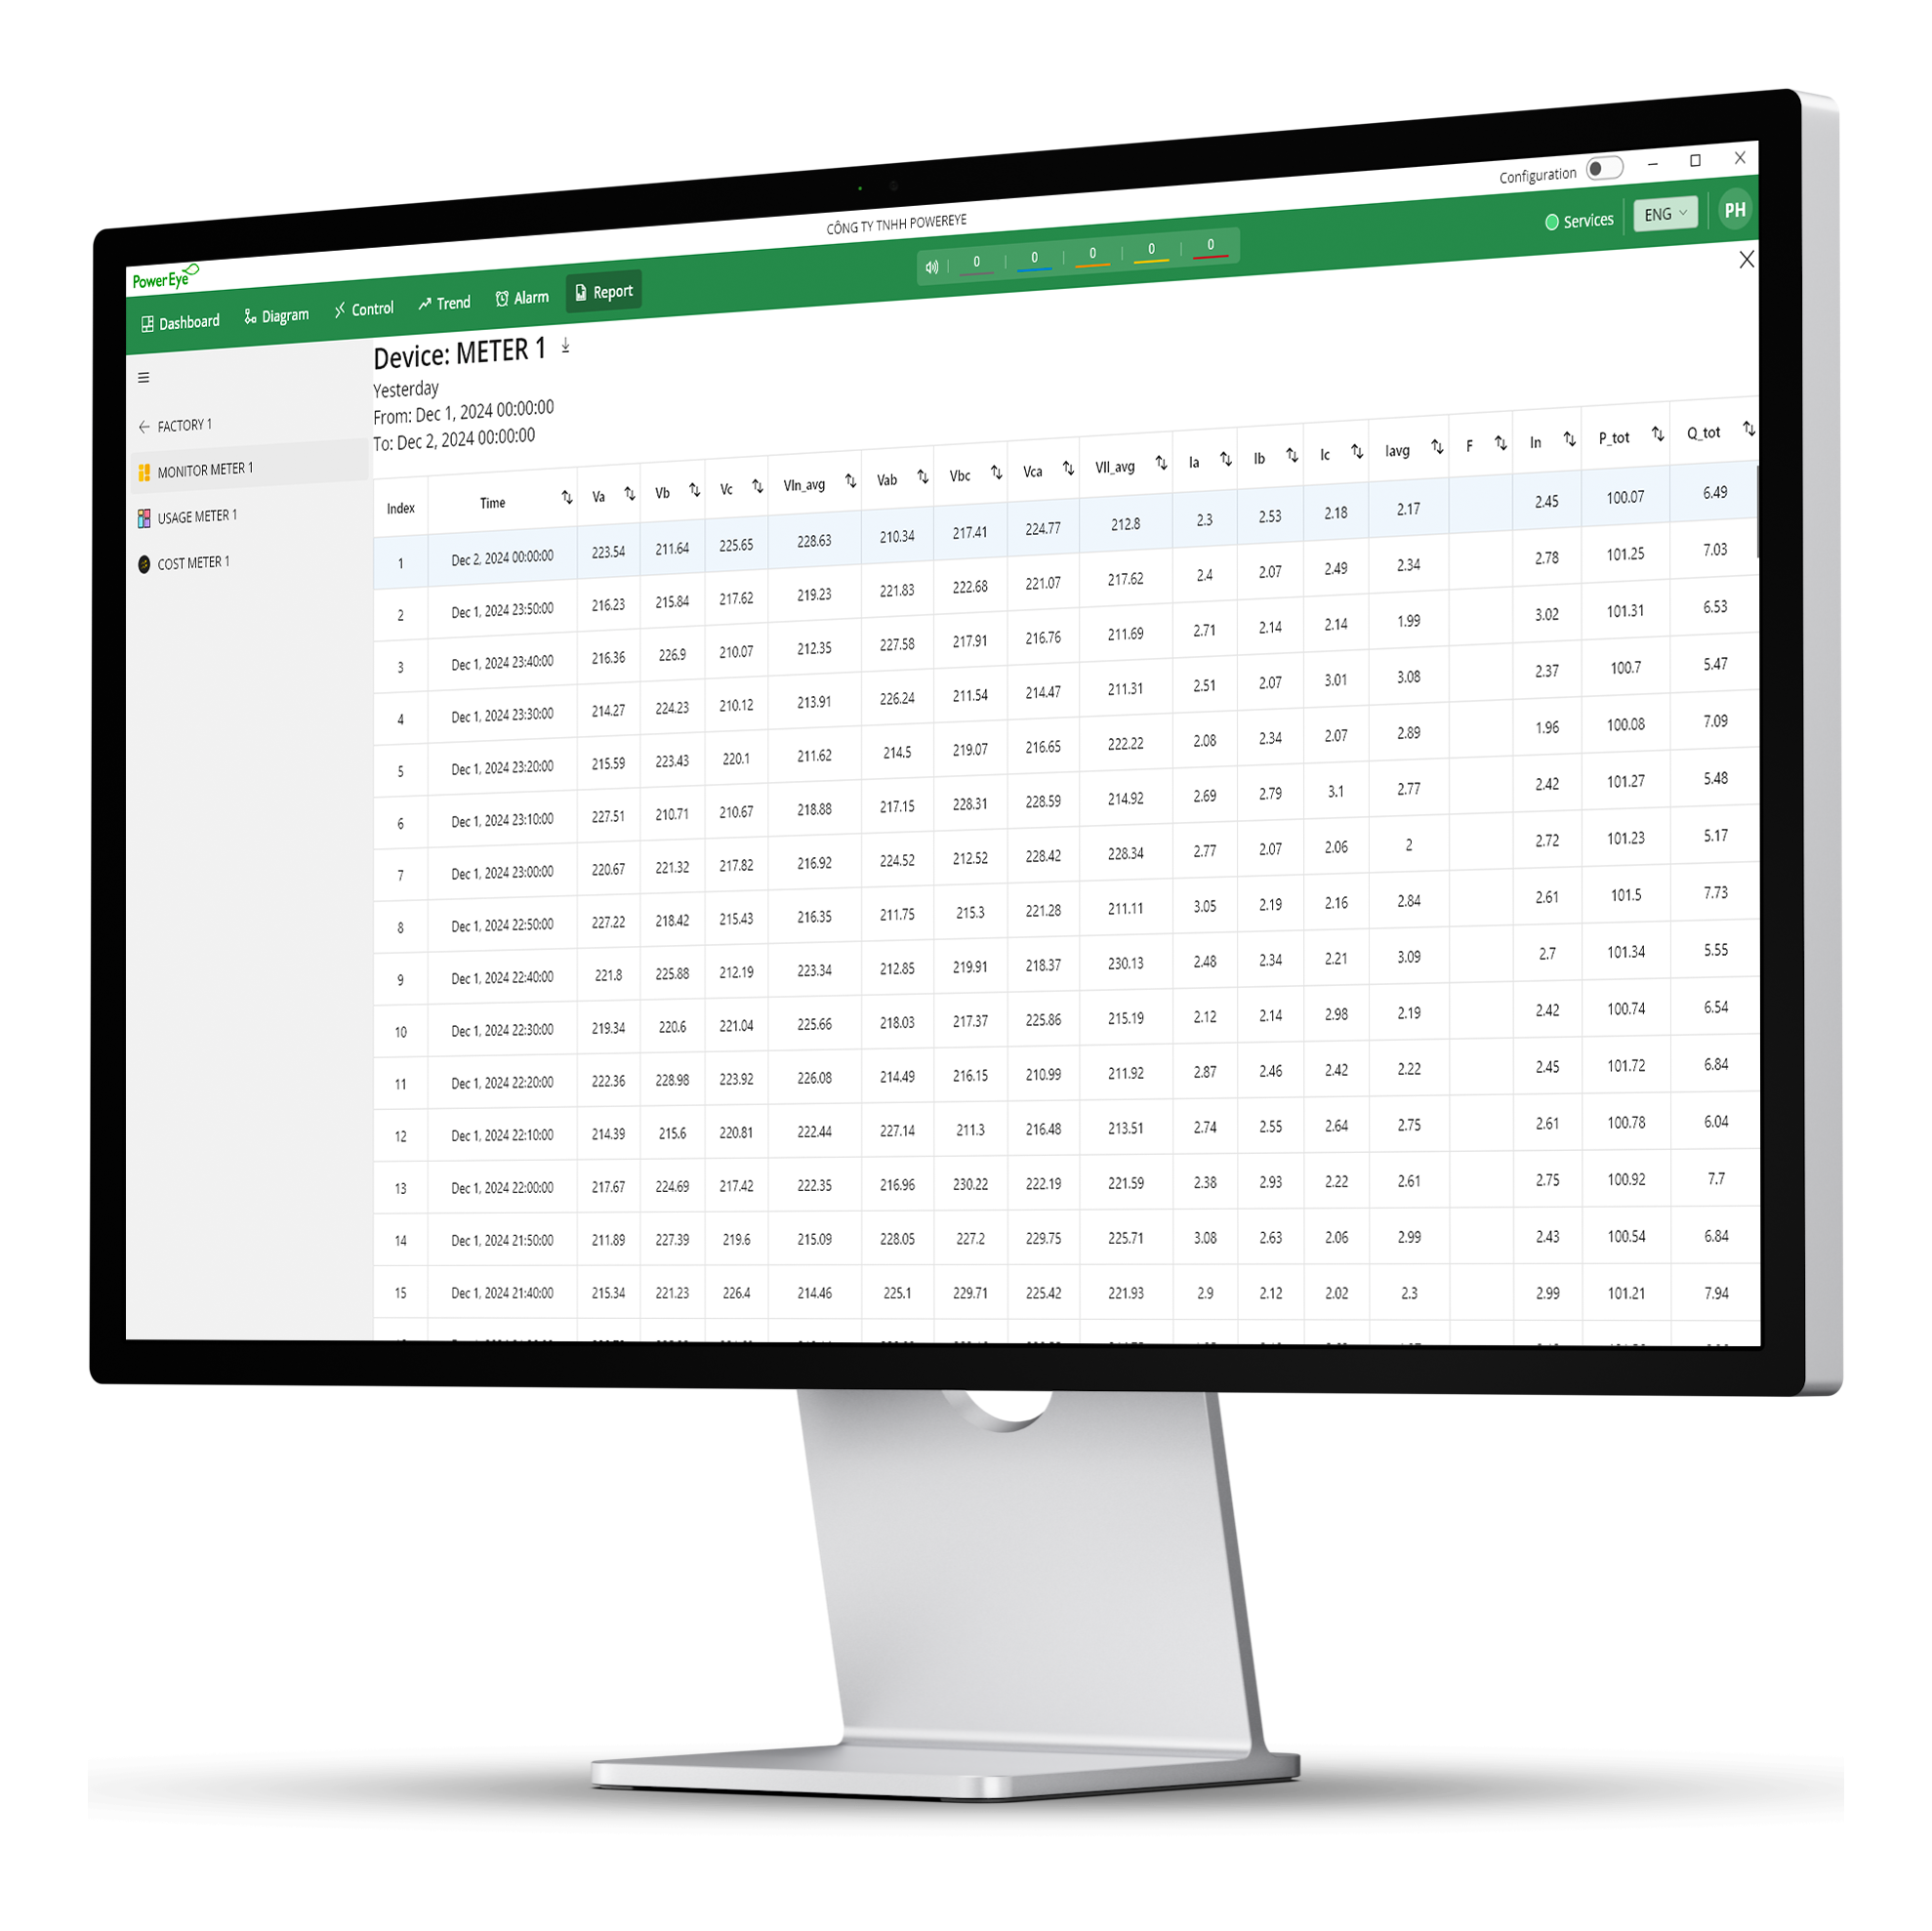
Report
Generate Accurate and Reliable Reports
PowerEye’s reporting feature allows you to create customized reports,
ensuring data accuracy and reliability. Export reports in multiple formats
to support decision-making and compliance needs.
- ✅ Data Selection: Choose any type of data to build reports tailored to your needs.
- ✅ Trusted Reports: Export PDF files with secure digital signatures for authenticity.
- ✅ In-Depth Analysis: Export Excel files for advanced data analysis and better decision-making.
System Architecture Diagram
PowerEye Ecosystem
Connect, monitor and manage all critical devices in your energy infrastructure.
PowerEye Ecosystem
Real-time Industrial Monitoring Platform
PC • Web • Mobile • Cloud
Meters
Sensors
PLC
UPS
Inverters - Solar
HVAC
PE Gateway
PowerEye Platform
PowerEye Project Application
PowerEye has been successfully deployed in numerous energy monitoring and management systems across Vietnam.
Our solution enables automated data collection from measurement devices, providing intuitive visualizations on real-time dashboards to assist operators in monitoring systems effectively.
PowerEye offers high compatibility, integrating seamlessly with a wide range of devices via standard industrial protocols, including Modbus RTU, Modbus TCP, RS485, and Ethernet.
Broadcasting & Television Centers
Current Status
The system—including substations, generators, and distribution boards—operates 24/7 under strict requirements for power stability and temperature.
PowerEye Solution
Deploying a 24/7 monitoring interface, along with Alarm and Diagram modules, to provide full visualization of the power grid and UPS systems.

24/7 Monitoring, Absolute Security.
Operational Experience
Technicians can monitor broadcasting power status remotely.
The system automatically sends instant notifications via a mobile app in the event of voltage fluctuations or server room temperature changes, preventing any risk of broadcast disruption.
Factories & Manufacturing Plants
Current Status
High difficulty in controlling energy consumption for individual production lines. Lack of automated tools leads to inefficient cost optimization and undetected energy waste.
PowerEye Solution
Utilizing Report and Trend modules to collect data from flow meters, energy meters, and pressure sensors.

Optimize Energy, Reduce Costs.
Operational Experience
Management gains a holistic view of energy KPIs.
Comparing “This Week vs. Last Week” helps optimize production schedules during off-peak hours, significantly lowering monthly utility bills.
Office Buildings & Corporate Facilities
Current Status
Lighting and HVAC systems are managed fragmentedly. Operators struggle to oversee device status across large areas, causing slow responses to incidents in isolated zones.
PowerEye Solution
Integrating centralized Control and Dashboard modules for unified management.

Smart Operation, Premium Comfort.
Operational Experience
Technical teams can control devices directly on the floor plan.
The intuitive interface allows new staff to master the system quickly, reducing manual errors and enhancing “Green Building” standards.
Optimize Operations – Master Your Data with PowerEye

Every project presents a unique management and monitoring challenge. PowerEye provides more than just software; we deliver solutions that transform raw data into operational value, ensuring long-term safety and sustainability.
Start Digitalizing Now!.
Request a Free Demo